How BirdView's data is built
Every number on a BirdView page comes from a published source through the commands shown below. Each source and table is a box listing its fields; each arrow says what a step does: a filter, a join, or a model.
How to read the fields. Each box lists one field per line, with one mark: ★ it reaches a page (and may also be used), · the pipeline uses it without showing it (a join key, a filter, a denominator), and ✗ nothing downstream uses it. Unused fields are listed so an auditor can see they were not forgotten. Italic text after a field is a note; italic text under a box's name says where the box lives.
Square boxes are data: a published source, a table in code, or a file a command writes. Rounded
boxes are things that run: a command, or a numbered step inside birdview-ingest. The steps are
not files; the ingest runs all eight in memory and writes species.json, and the counties apart in counties.gob.gz. Dotted arrows are
facts copied into code rather than data read by a program. The diagram's corner repeats this
legend.
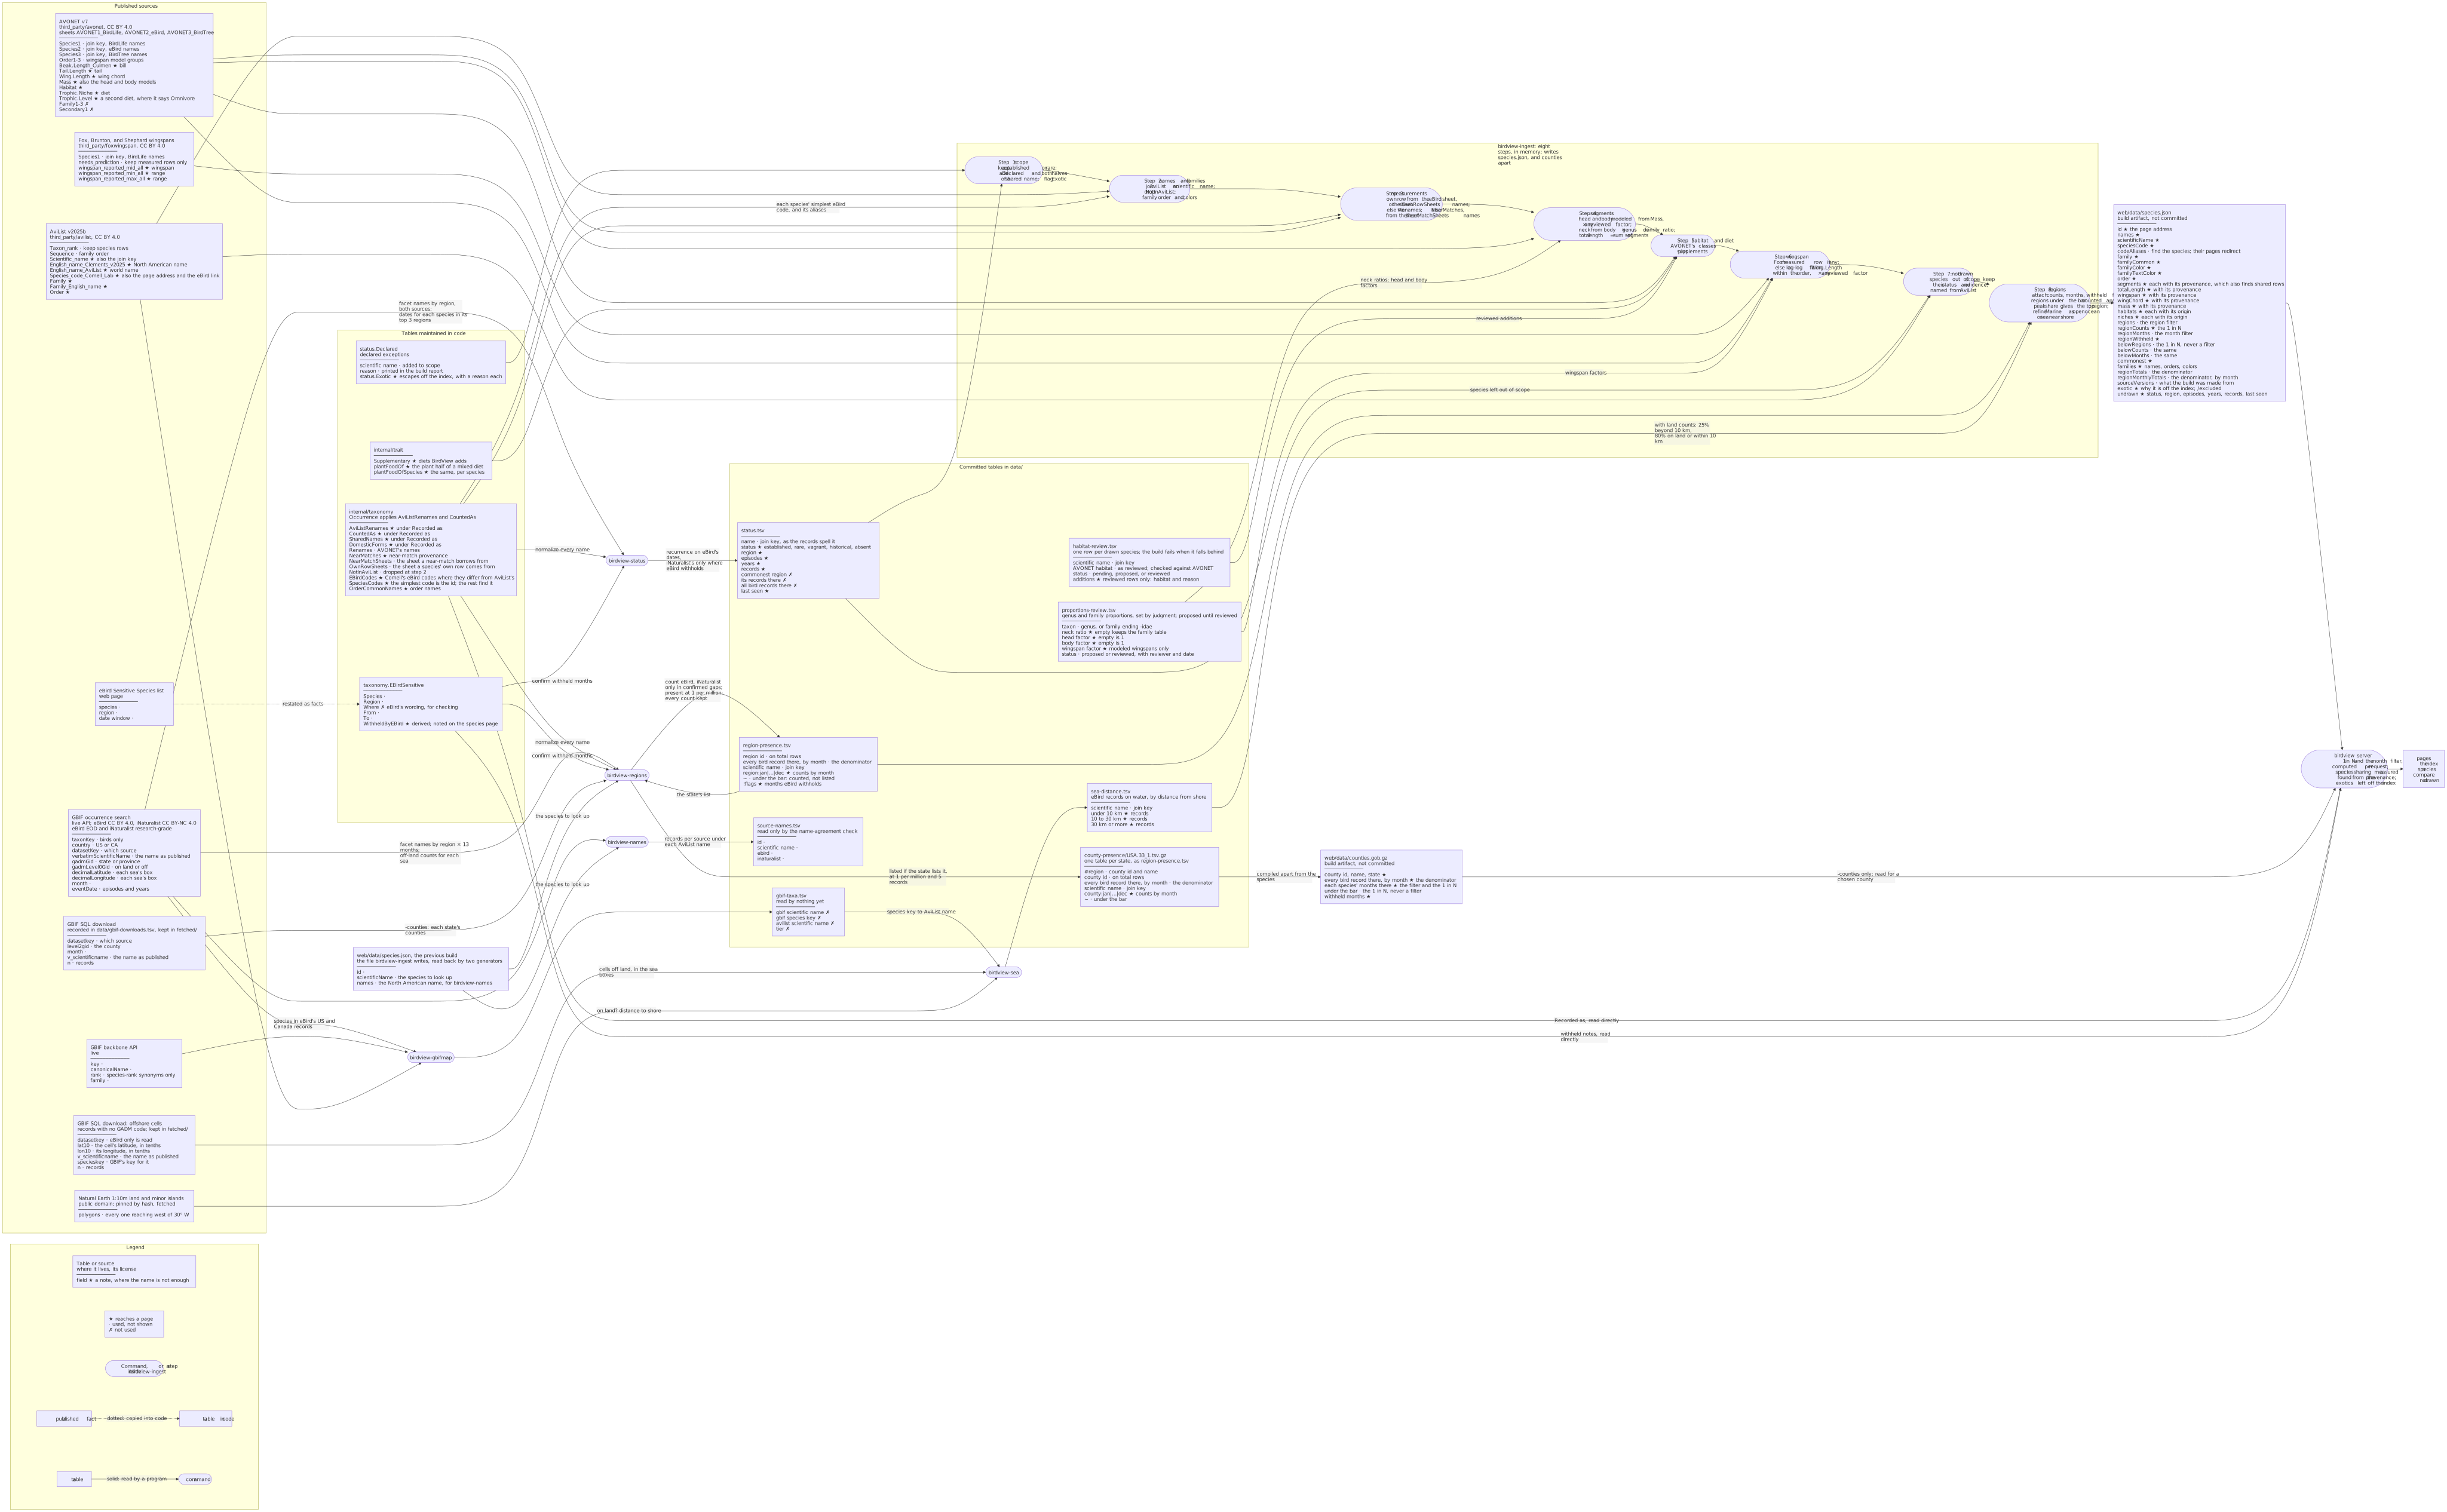
Select the diagram to open it full size.
GitHub draws the diagram from this source; BirdView serves a pre-rendered picture of it, so the page needs no network.
The steps
Scope comes from recurrence. birdview-status asks GBIF which names each land region records,
then fetches the dates behind each species in its three regions with the most records. From how
those dates fall into episodes and years it assigns a status: established, rare, vagrant,
historical, or absent. Established and rare species are in scope. eBird's dates count
everywhere; iNaturalist's count only in a region and month where eBird is confirmed to withhold
the species. status.Declared, a short list in code, adds species the open records cannot speak
for, each with its reason. See where the data comes from and the
decision to count eBird first.
Open ocean or near shore comes from distance to shore. birdview-sea reads the offshore-cells
download's eBird records, drops each 0.1° cell whose center lies on Natural Earth's land, and bands
the rest by distance to shore, per species, into data/sea-distance.tsv. The ingest, after the
regions, gives every bird with Marine the refinement that follows: open ocean when a quarter of its
records on water lie more than 10 km out, sea near shore when fewer do or when 80% of all its
records lie on land or within 10 km; see where the data comes from.
Proportions are reviewed by genus. The neck ratio of step 4 comes from the family table in the
code, and the head and body from mass, unless data/proportions-review.tsv has a row for the bird's
genus or family; a row may also scale a modeled wingspan in step 6, never a measured one. Rows are
proposed, set by judgment, until a source other than photographs supports them; photographs
foreshorten the parts the figure draws
(decision).
Region counts come from the same source. birdview-regions asks GBIF for every name recorded
in every region, for the whole year and for each month. For species mostly seen at sea, it also
counts off-land records inside each of BirdView's sea boxes. A species is present in a region
when it reaches 1 record per million of all bird records there. eBird's records count everywhere;
iNaturalist's are added only where eBird's
Sensitive Species list names the species and the
records confirm that eBird is withholding it. Records where a species stays under the bar are kept,
marked ~: the ingest counts them in the 1 in N and leaves the species off that region's list.
Names are normalized before anything is matched. Both commands map every published name onto
the AviList name by the same rules: a subspecies is reduced to its species, genus moves and names a
source files under another species are mapped through the tables in internal/taxonomy, and a
hybrid matches no species. birdview-regions applies these rules through taxonomy.Occurrence;
birdview-status applies the same tables in its own code and drops hybrids, which have no status.
Where a name table applies to a species, its page says so under Recorded as.
The ingest joins everything into one file, in eight steps. It keeps the in-scope species
(step 1), names them and their families from AviList (2), measures them from AVONET (3), models
the segments no source measures (4), assigns habitat and diet (5), takes wingspan from Fox where it
was measured and estimates it where it was not (6), records the species it does not draw and why
(7), and attaches the region counts (8). Counties are compiled apart, into counties.gob.gz, which
the server reads only with -counties and only for the counties chosen. Every metric carries its
provenance (measured, near-match, or modeled), and the page shows which. See
what is measured and what is modeled.
AVONET has three taxonomy sheets, and step 3 chooses between them. A species' own row comes
from the eBird sheet unless OwnRowSheets names a narrower one: the eBird sheet's Larus
argentatus contains every herring gull, so European Herring Gull is read from the BirdLife sheet.
A species missing from the eBird sheet is looked up under its own name in the other two sheets,
then under the older names in Renames; either way the row is its own, so it counts as measured.
A species with no row of its own borrows a relative's, labeled near-match, from the sheet
NearMatchSheets names where one holds a narrower concept of that relative. If a named sheet lacks
the row, the build stops rather than fall back to a broader one.
Escapes are flagged, not dropped. status.Exotic lists in code the birds whose records here
are escapes or birds kept by people. The ingest marks each with its reason; the server leaves them
off the index and its controls, lists them at /excluded, and keeps their pages.
The server does the last arithmetic. The 1 in N on a tile and the month filter depend on the
regions and months a reader selects, so they are computed per request from the counts and totals
in species.json. The server also finds species drawn from the same AVONET row, from their
provenance, and notes the shared measurements on both.
birdview-boundaries sits outside this pipeline. It writes data/region-boundaries.json, the
region outlines the Here button tests a reader's position against, from Natural Earth's states and
provinces and BirdView's own sea boxes. The server reads it directly; nothing in the dataset
depends on it.
Where to go next
- For what each figure means and how far to trust it: where the data comes from.
- For running the pipeline yourself: building BirdView.
- For every source's license, version, and hash: the source register.